prometheus
官网地址
架构图
prometheus 介绍
prometheus是一个基于时间序列(time_series)的监控软件,它是由soundCloud开源监控告警解决方案,从2012年开始编写代码,再到2015年github上开源,已经很多大公司使用,2016年prometheus成为继kubernetes后,第二个CNCF(cloud native Computing Foundation云原生计算基金会)的成员。2017年底发布了基于全新存储层的2.0版本,它能够提供指标数据的采集、存储、查询、告警等功能,能更好地与容器平台、云平台配合,并同时支持告警。
prometheus 主要功能
- 多维数据模型(时序由metrics[指标]和k/v的labels构成)
- 灵活的查询语句(PromQL)支持基本数据运算和函数
- 无依赖存储,支持local和remote不同的模型
- 采用http协议,使用pull/push模式来获取数据
- 监控目标,可以采用服务发现和静态配置的方式
- 支持多种统计数据模型,配合grafana使用图形化友好
prometheus 核心组件
- prometheus server:主要对获取的数据和存储时序数据,另外还提供查询和alert rule(报警规则)配置管理
- client libraries:用于对接prometheus server,可以查询和上报数据
- Pushgateway: 用于批量,短期的监控数据的汇总节点,监控主机上报给pushgeateway,然后pushgateway上报给prometheus sever。
- exporters: 各种汇报数据的exporters,例如汇报机器数据的node_exporter,汇报docker情况的cAdvisor
- alertmanager: 是独立于Prometheus的一个组件,用于告警通知的
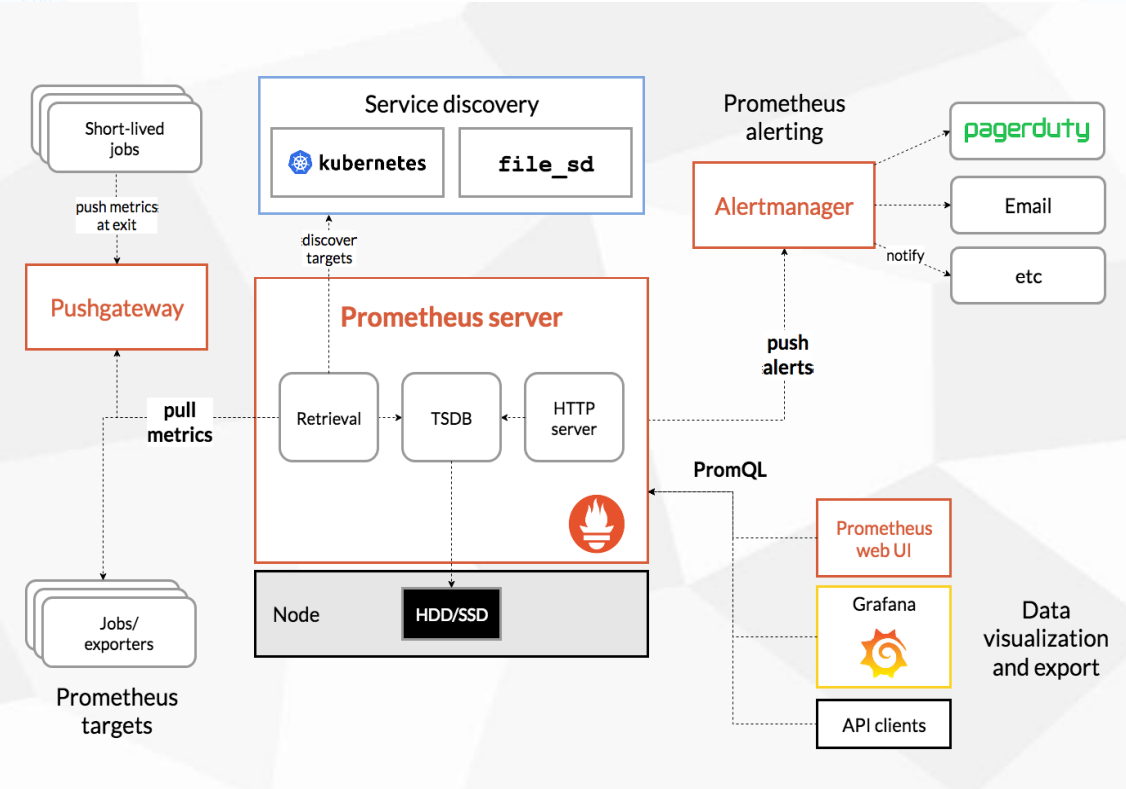
prometheus 基础架构图
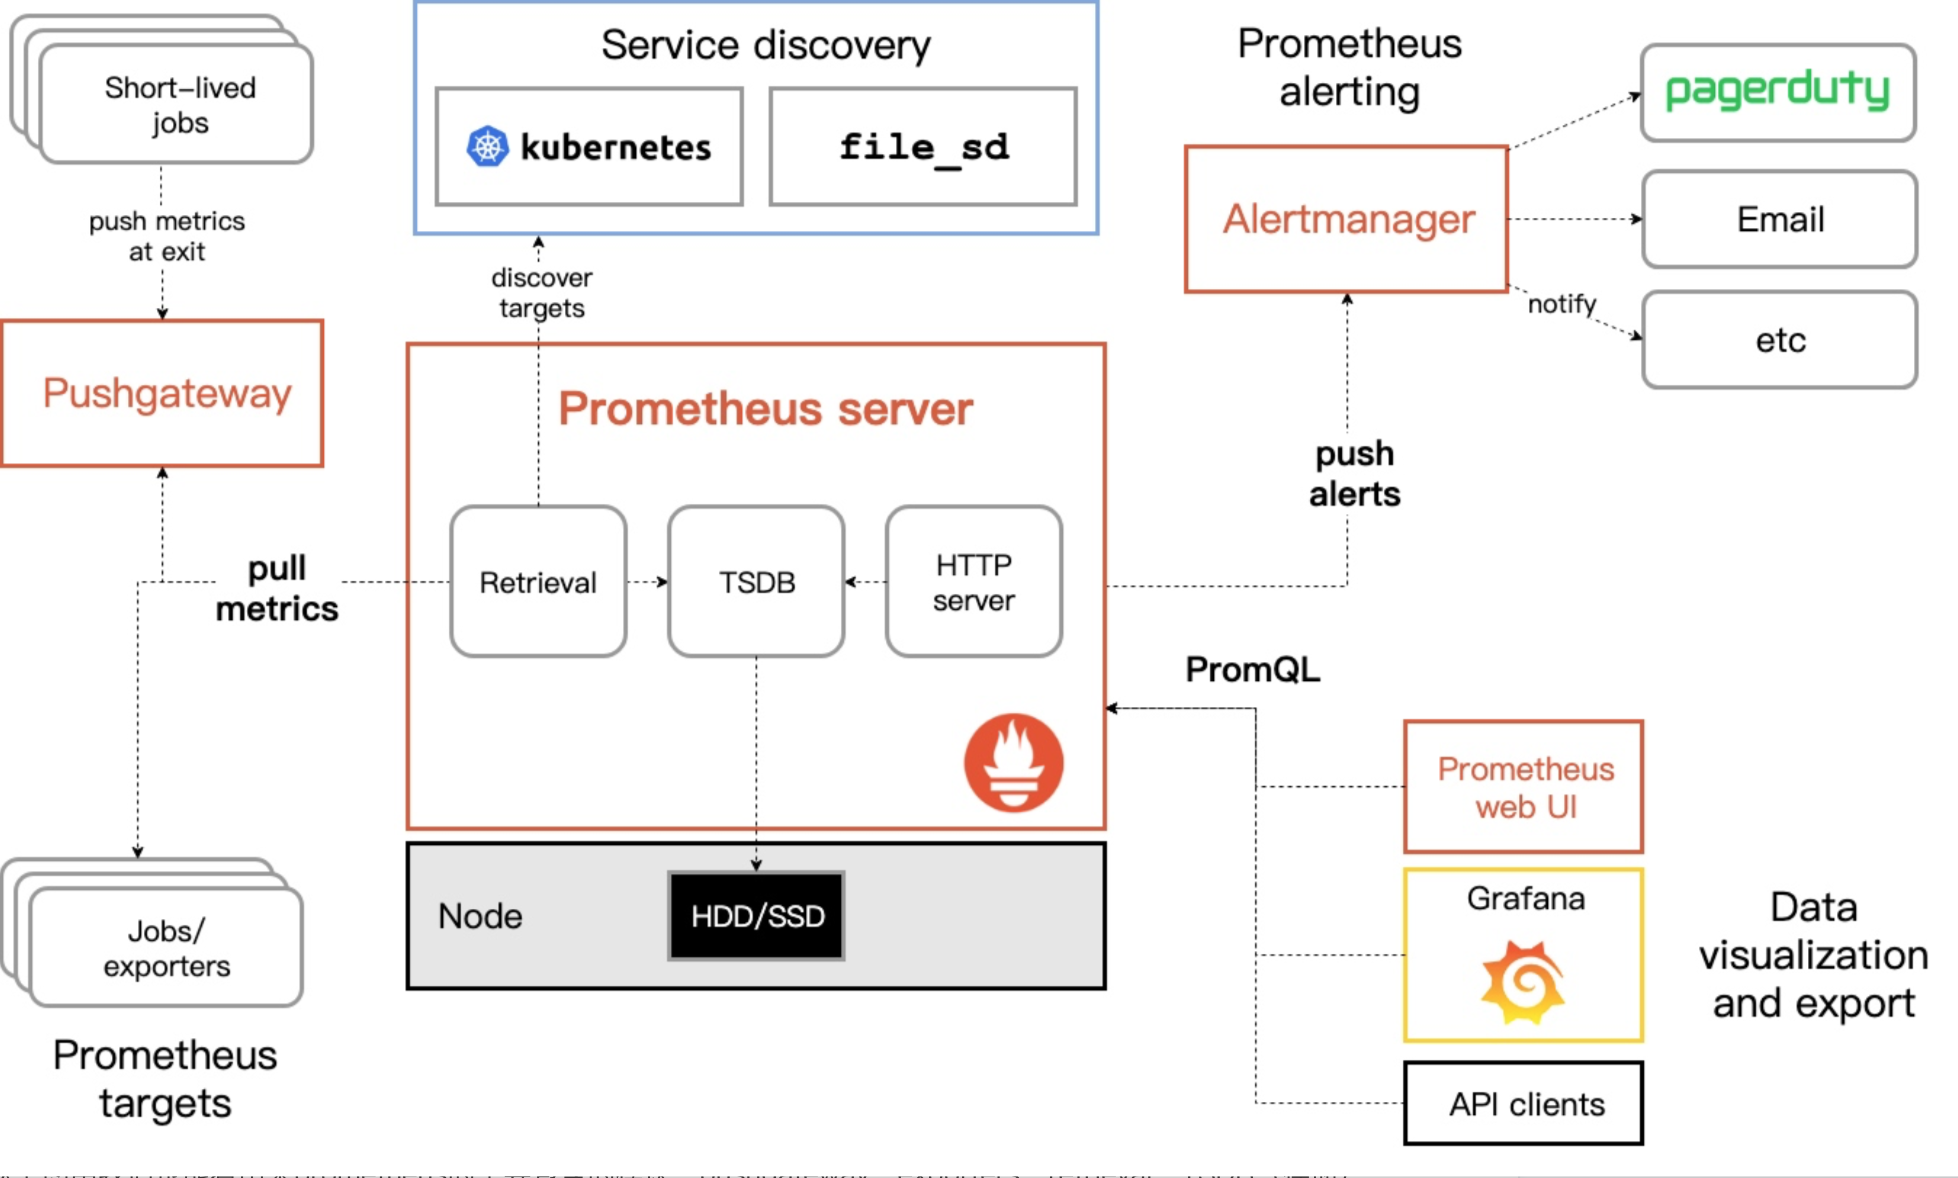
主要包含的模块,pushgateway,exporters,retrieval,TSDB(存储)HTTP,PromeQl,Alertmanager。
他的大致逻辑是这样的:
- 一、拉数据 prometheus会定期从静态配置的targets或者服务发现的targets中向部署在被监控端的服务器上请求exporters来获取数据,或者由客户端通过定时任务定期向pushgateway发送数据,然后有pushgateway向prometheus发送数据。
- 二、保存数据 当新的数据大于配置内存缓存区的时候,prometheus会将数据持久化到磁盘,(如果使用remote storage将持久到云端)
- 三、监控图形 prometheus可以配合grafana通过特定的表达是来获取我们想要的监控图形
- 四、规则告警 prometheus可以配置rules(规则),然后定时查询数据,当触发告警条件的时候,会通知alertmanager推送到配置的告警信息上去,alertmanager收到告警信息的时候,可以根据配置,聚合,去重,降噪最后发送警告
prometheus 安装
K8S安装
配置文件
/path/to/config/prometheus.yml
1
2
3
4
5
6
7
8
9
10
11
12
13
14
15
16
17
18
19
20
21
22
23
24
25
26
| # 全局配置
global:
scrape_interval: 15s # 默认抓取间隔, 15秒向目标抓取一次数据。
evaluation_interval: 15s # 评估告警规则时间间隔,默认1分钟
scrape_timeout: 10s # 采集数据超时时间,默认10秒
external_labels:
monitor: 'codelab-monitor'
# 这里表示抓取对象的配置
scrape_configs:
# 这个配置是表示在这个配置内的时间序例,每一条都会自动添加上这个{job_name:"prometheus"}的标签
- job_name: 'prometheus'
scrape_interval: 5s # 重写了全局抓取间隔时间,由15秒重写成5秒
static_configs:
- targets: ['localhost:9090']
# Alertmanager 组件配置
alerting:
alertmanagers:
- static_configs:
- targets:
- IP:9093
# 加载自定告警规则
rule_files:
- "rules/*.yml"
|
启动参数
- –web.enable-lifecycle 启用远程热加载配置文件 调用指令是
1
| curl -X POST http://localhost:9090/-/reload
|
- –storage.tsdb.path=”/data/prometheus_data” 指定TSDB数据库持久化目录
- –storage.tsdb.retention.time=90d 修改数据保存时间。
- –web.listen-address= “0.0.0.0:9090” 监听地址和端口
- –log.level=info 日志级别
- –alertmanager.timeout=10s 与报警组件的超时时间
命令
1
2
3
4
5
6
7
8
|
$ promtool check config /opt/prometheus/cfg/prometheus.yml
Checking /opt/prometheus/cfg/prometheus.yml
SUCCESS: 0 rule files found
$ kill -HUP $MAINPID
$ systemctl reload prometheus
|
二进制安装
下载安装包
1
2
3
4
5
6
7
8
9
10
11
12
13
14
15
16
17
18
19
20
21
22
23
24
|
cd /usr/local/src
wget -c https://github.com/prometheus/prometheus/releases/download/v2.33.5/prometheus-2.33.5.linux-amd64.tar.gz
mkdir -p /data/prometheus_data
cd /usr/local/src/
tar xvf prometheus-2.33.5.linux-amd64.tar.gz
mv /usr/local/src/prometheus-2.33.5.linux-amd64 /usr/local/prometheus-2.33.5
ln -s /usr/local/prometheus-2.33.5 /usr/local/prometheus
chown -R root.root /usr/local/prometheus-2.33.5
ln -s /usr/local/prometheus/promtool /usr/local/bin/promtool
ln -s /usr/local/prometheus/prometheus /usr/local/bin/prometheus
mkdir -p /usr/local/prometheus/rules
mkdir -p /usr/local/prometheus/token
|
目录结构:
1
2
3
4
5
6
7
8
9
10
11
12
13
14
15
16
17
18
19
20
21
22
| $ tree /usr/local/prometheus
/usr/local/prometheus
prometheus
├── console_libraries
│ ├── menu.lib
│ └── prom.lib
├── consoles
│ ├── index.html.example
│ ├── node-cpu.html
│ ├── node-disk.html
│ ├── node.html
│ ├── node-overview.html
│ ├── prometheus.html
│ └── prometheus-overview.html
├── LICENSE
├── NOTICE
├── rules
├── token
├── prometheus
├── prometheus.yml
└── promtool
|
配置 systemd 服务
1
2
3
4
5
6
7
8
9
10
11
12
| $ vim /etc/systemd/system/prometheus.service
[Unit]
Description=prometheus
[Service]
ExecStart=/usr/local/bin/prometheus --config.file=/usr/local/prometheus/cfg/prometheus.yml --storage.tsdb.path="/data/prometheus_data" --storage.tsdb.retention.time=90d
ExecReload=/bin/kill -HUP $MAINPID
KillMode=process
Restart=on-failure
[Install]
WantedBy=multi-user.target
|
开机启动
1
2
3
| systemctl daemon-reload
systemctl start prometheus
systemctl enable prometheus
|
docker安装
1
2
3
|
mkdir -p /path/to/config
mkdir -p /path/to/data
|
1
2
3
4
5
6
7
8
| docker run --name=prometheus -d \
-p 9090:9090 \
-v /path/to/config:/etc/prometheus \
prom/prometheus:v2.7.2 \
--config.file=/etc/prometheus/prometheus.yml \
--web.enable-lifecycle \
--storage.tsdb.path=/path/to/data \
--storage.tsdb.retention.time=90d
|
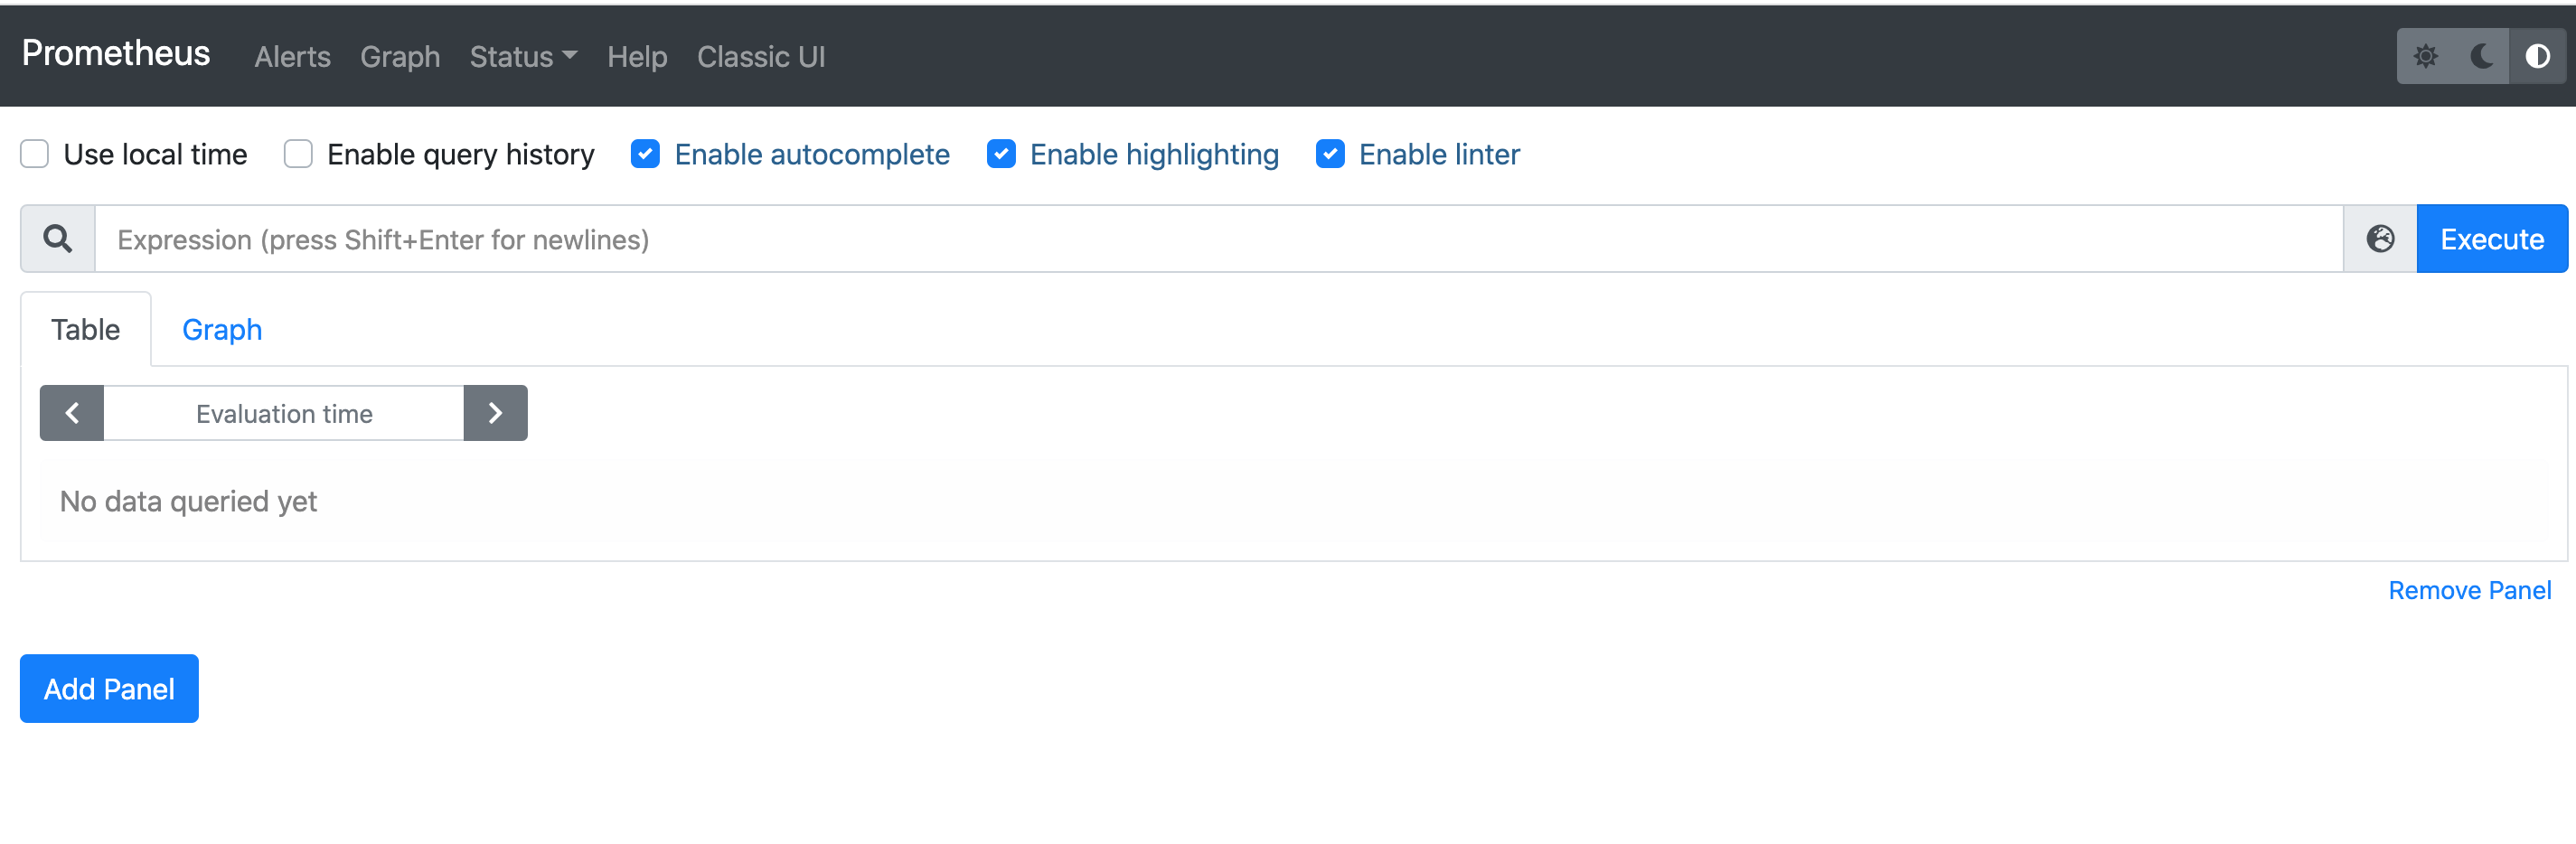
web 界面
http://IP:9090
常用命令
1
2
3
4
5
6
7
8
|
$ promtool check config /opt/prometheus/cfg/prometheus.yml
Checking /opt/prometheus/cfg/prometheus.yml
SUCCESS: 0 rule files found
$ kill -HUP $MAINPID
$ systemctl reload prometheus
|